Ajinkya Koshti

Hi! My name is Ajinkya and I'm a data scientist located in Ames, IA.
I specialize in unstacking business value of data and delayering complex problems with state-of-the-art data science techniques. For more details, check out the About Me section.
View My LinkedIn Profile
About Me
Hi! I am a data scientist located in Ames, IA. I hold expertise in building state-of-the-art machine learning models & executing scalable cloud solutions. During my past stints as a data scientist, I helped a healthcare company achieve $9.2 million in increased investment returns, an agricultural company save 5% of global crop loss and contributed to open source projects helping physicians diagnose the aggressiveness of cancer.
My eye always goes to the outcome. Take a look at all my latest work to understand in more detail about what I do.
Projects
Deep Learning Projects
Soybean Root Image Classification - Project with Syngenta Corp, IA
About 2000 plants worldwide are susceptible to infection by root-knot nematodes and they cause approximately 5% of global crop loss. Image processing and deep learning techniques can be used to diagnose these diseases quicker and with minimal human assistance. With significant amount of labeled images to train on, our models can classify soybean roots as resistant or susceptible with up-to 90% accuracy.
Face recognition to recognize players can be an useful application in sport analytics. A lot of in-game metrics like xG and xA scores, heatmaps depend on some kind of deep learning algorithms running in the backend. Leading to that, this is a fun project that I did to implement pretrained models on data stream created from google images. First 200 google images of 3 famous footballers were fed to this model to see how well the model is able to train on an uncurated noisy data. It was a practice in building data pipelines, creating image transforms, importing pretrained models and optimizing the learning rate.
Machine Learning Projects
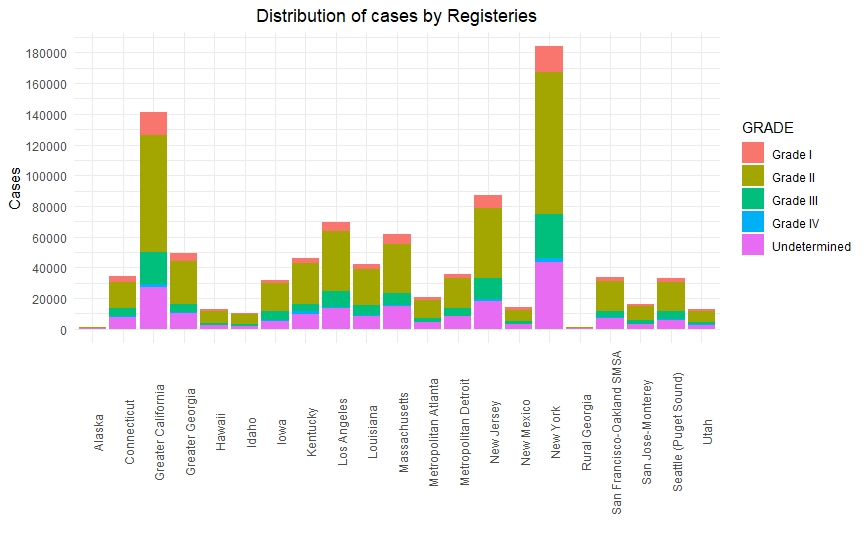
Cancer Grade Prediction - Project with National Cancer Institute’s SEER data

After cancer is diagnosed, healthcare providers need to learn as much as they can about it. This helps them to plan the best treatment and look at overall outcomes and goals. For many types of cancer, part of this process includes figuring out the cancer grade and stage. Bsed on patient’s medical history, our data-driven models can predict the cancer grades thus acting as a deicision suport tool for the healthcare providers.
The project demonstrates the use of interesting pre-processing as well as feature engineering techniques to make the real-world data ready for analysis. With advanced tree-based ensemble models, we were able to achieve the AUC (area under curve) close to the state-of the-art AUC as per current research.
Predicting Time Until Next Earthquake by Analyzing Seismic Waves from Earth’s Subsurface

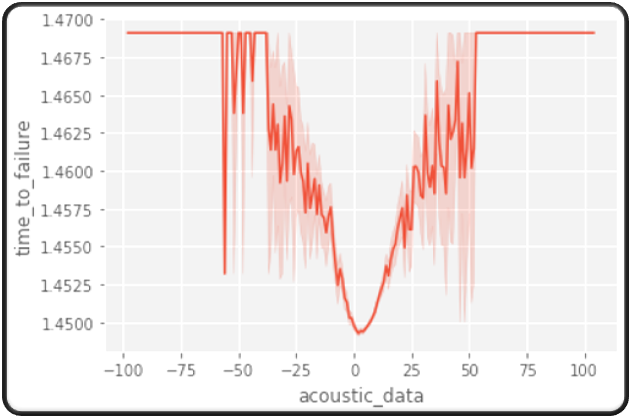
Earthquakes has devastating consequences in terms of living and financial cost. The GeoNet project locates 50 to 80 earthquakes each day and 20000 per year. Going back to the CEDIM repot, in 2011 earthquakes alone and their consequences, such as tsunamis, landslides, and ground settlements, caused a damage of $365 billion U.S. dollars. According to the CEDIM analysis, 20,500 people died, about a million people lost their homes. Hence, forecasting the size and the timing of earthquakes becomes a significant challenge.
Los Almos National Laboratory (LANL) tries to solve this challenge by make available the seismic data obtained from laboratory earthquakes for data scientists to work upon. The data is labeled with the time it took for the lab sample to undergo an earthquake. We use this data to train a predictive model, fine-tune it and test on unseen data. We tested several machine learning algorithms to reduce the Mean Absolute Error (MAE) between actual and predicted times until next earthquake.
Optimal Factor Portfolio Allocation

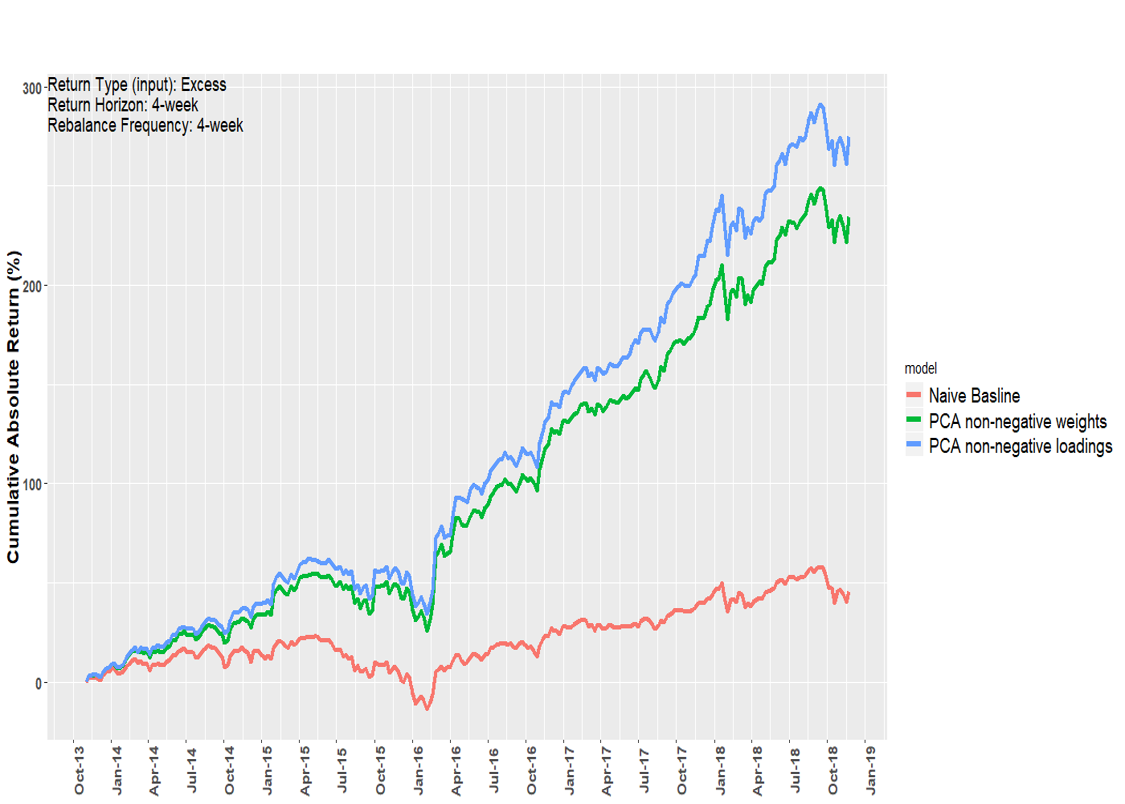
Factor portfolio is a portfolio of stocks where inclusion is defined by a single factor, such as book to price, 12-month return, and 12-month volatility. In this project, our objective was to develop a system that consumes stock-level signal data and recommends a factor policy (i.e. an allocation to each factor portfolio) which maximizes reward while controlling risk. We developed a pipeline system to combine inputs with models to generate weights and resulting performance metrics. We used Markowitz Mean-Variance and Principal Component Analysis (PCA) model to generate weights for factor portfolios. These models under all market conditions, are designed to give higher returns than the baseline.
Business Intelligence Projects
A simple visualization to check some cool Tour de France stats. You can see visualizations that depict in great detail the story of this celebrated bicycle race ever since its inception in 1903.
The Inc. 5000 is the Inc. magazine's annual list of the 5000 fastest growing private companies in the United States. This story contains dashboard depicting some cool stats about those comapnies and their demographics.
Page template forked from evanca