Ajinkya Koshti

Hi! My name is Ajinkya and I'm a data scientist located in Ames, IA.
I specialize in unstacking business value of data and delayering complex problems with state-of-the-art data science techniques. For more details, check out the About Me section.
View My LinkedIn Profile
Soybean-Root-Image-Classification
“About 2000 plants worldwide are susceptible to infection by root-knot nematodes and they cause approximately 5% of global crop loss. Image processing and deep learning techniques can be used to diagnose these diseases quicker and with minimal human assistance. With significant amount of labeled images to train on, our models can classify soybean roots as resistant or susceptible with up-to 90% accuracy.”
Background
Plant disease diagnosis through optical observation incorporate some level of complexity, making it difficult to successfully diagnose specific diseases. Our goal is to build a data-driven model to identify whether the Soybean variety is susceptible or resistant to southern root knot nematode disease. We will be using different predictive modeling techniques to analyze the soybean root images.
Data
We had very limted amount of data for this project. We used images of soybean roots that were labelled into two categories as- resistant or susceptible. We had around 300 images for analysis, which is quite a small number.
Working with small data is always a challenge. The algorithms don’t have enough to learn the patterns and hence they tend to overfit, thus deteriorating the performance of models in production.
Traditional Machine Learning Models
Before diving straight into deep learning frameworks and neural networks, we first used traditional machine learning algorthms to get a sense of the baseline for our analysis.
To facilitate this, we used feature extraction techniques in Python environment. We extracted features like contours, convex hulls, dimensional features and Prewitt filter horizontal and vertical edges. These extracted features were then used as attributes to train machine learning models like Naive-Bayes, Random Forests, K-Nearest Neighbors and Support Vector Machines.
Feature Importance
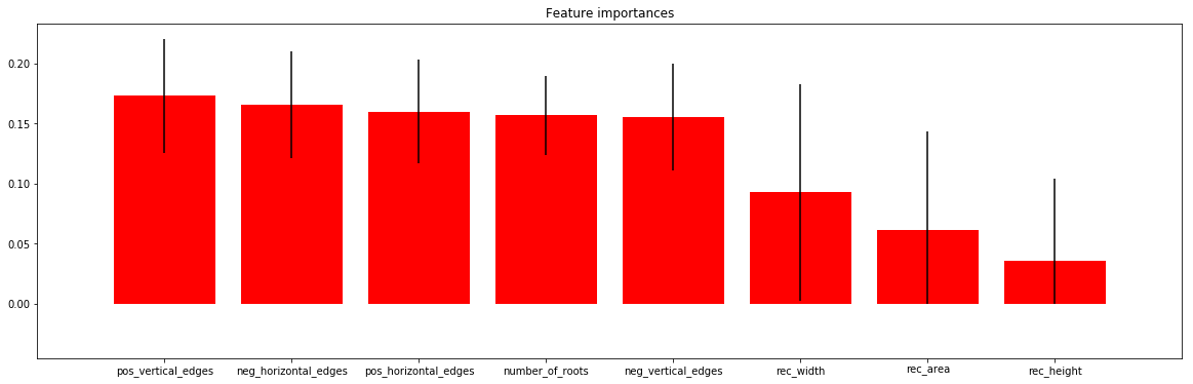 We see from the results above that features like positive vertical edges, negative horizontal edges were more significant than the other features. Features like rectangle height, rectangle area which denote the size of the roots were not deemed important by the algorithm. This was inline with what the pathologists at Syngenta considered. According to them, the size of the roots was indeed not a criteria to distinguish images as susceptible or resistant.
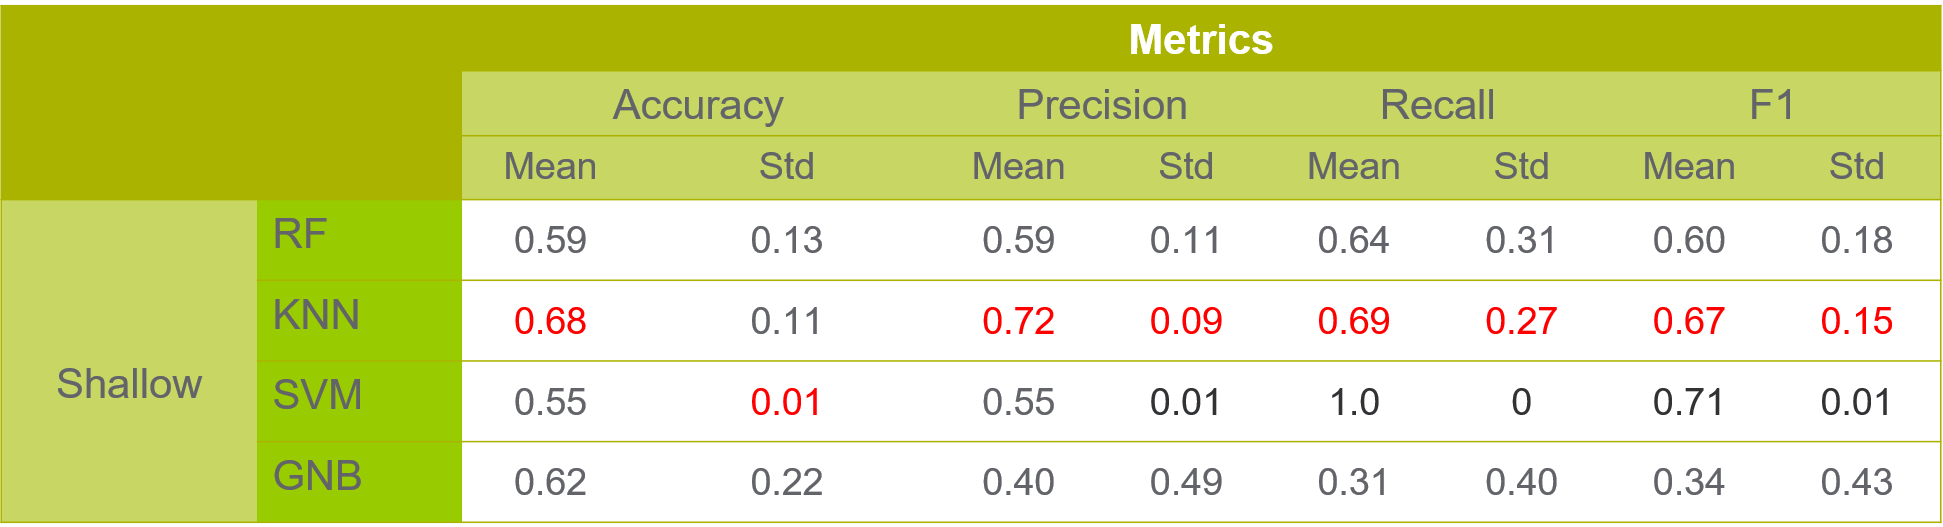
Results of Traditional Machine Learning Models
Deep Learning
We used different deep learning frameworks to build and train the neural networks. Notably, we used TensorFlow and FastAI, which was really easy to use for transfer learning.
Image transformations
Another technique than can be used to cope with the limitation of data availability is creating innovative image transformations. The well accepted transformations include flipping the image, skewing them, rotating them, increasing and decreasing the brightness, warping them. These kinds of transformations help us create multiple images out of single image, thus enriching our dataset.
We also use transformations like contours and convex hulls and tested the neural networks on both set of images.
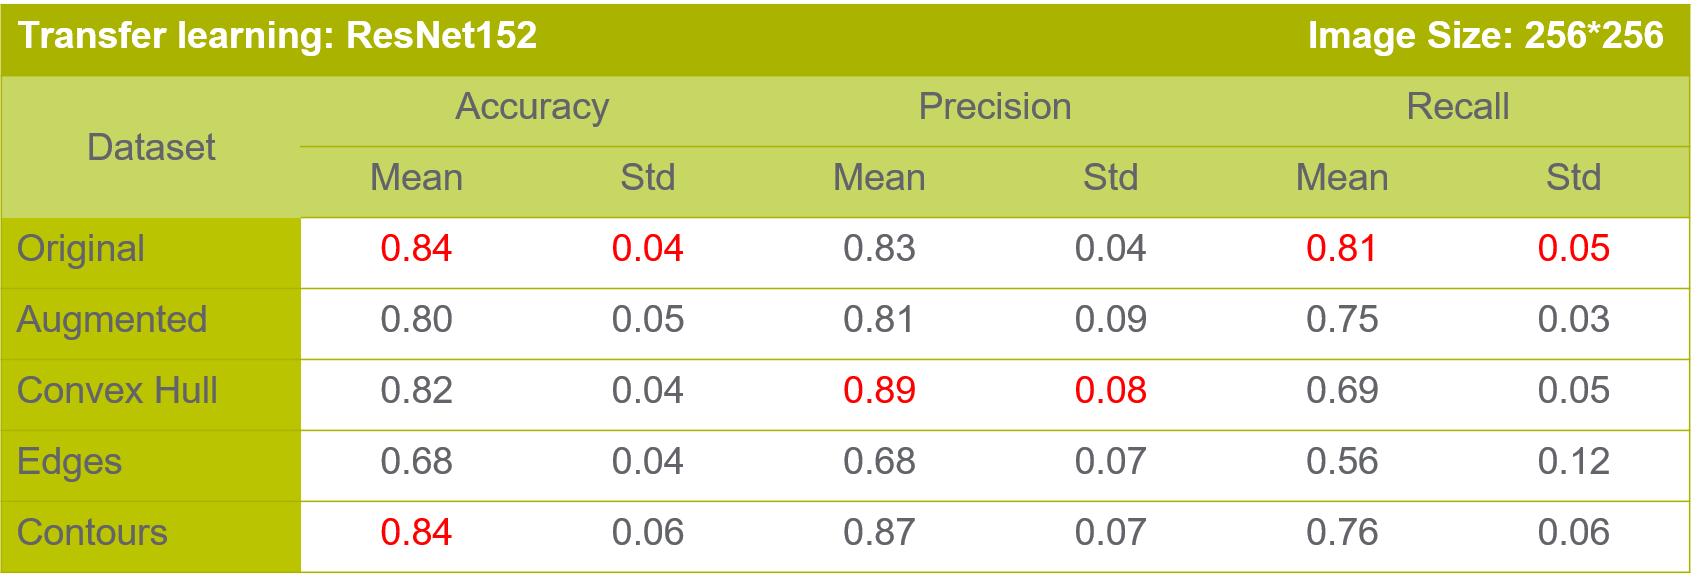
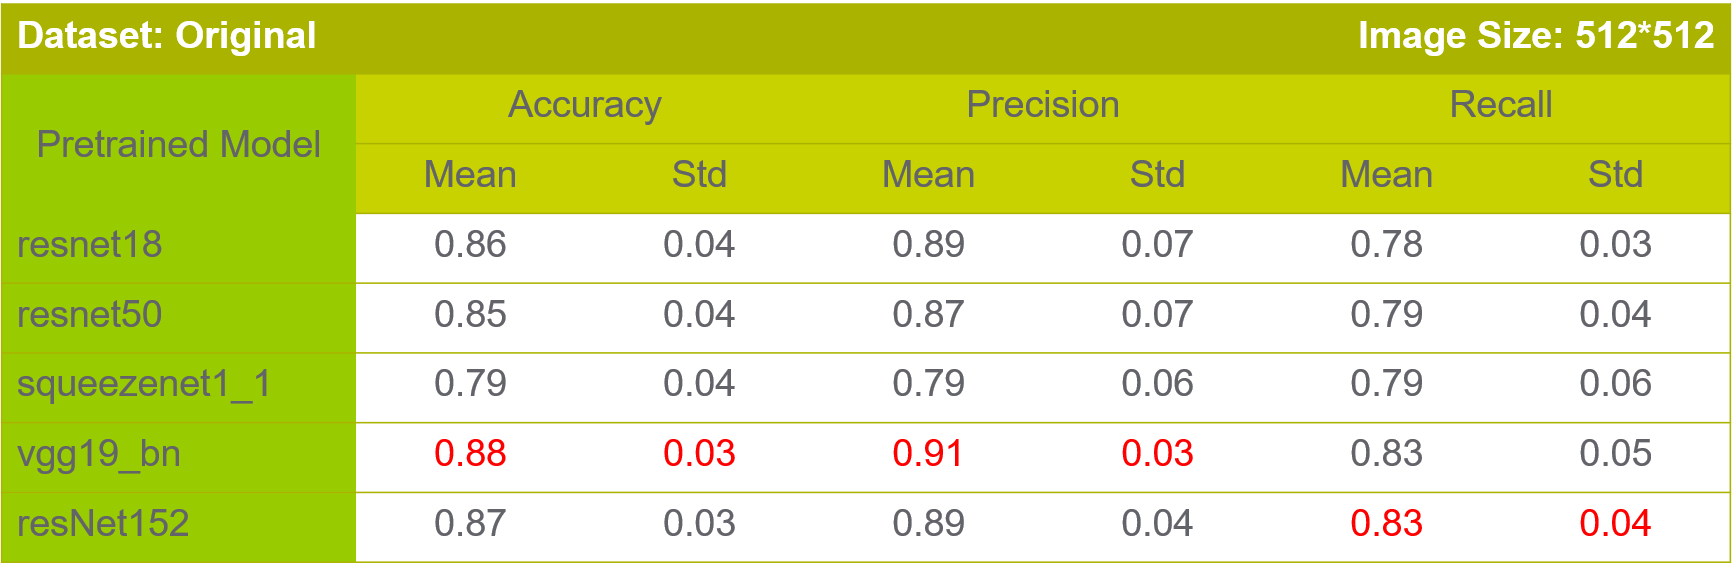
Transfer Learning
Transfer learning is a methodology where we use pretrained models (on a different data) and adapt them to our data. This saves the computational effort of building the models from the scratch. Transfer learning is the best way to combat limitations of small data.
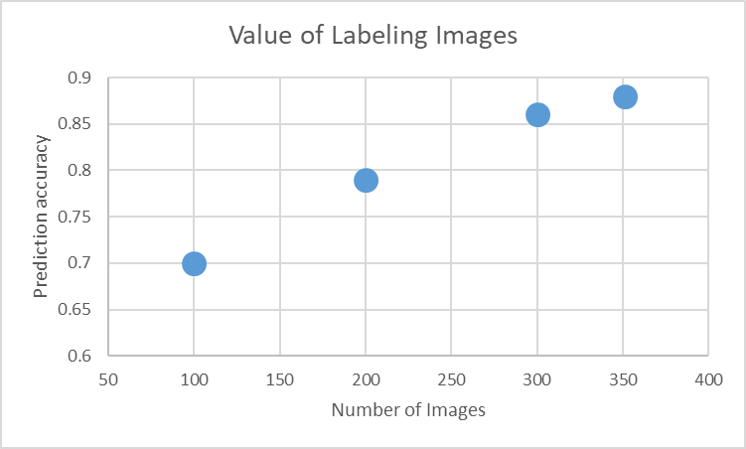
Business Value of Labeling More Images
As we already discussed that we have limited number of images. The reason for this is labeling images requires a lot of expertise and a lot of dedicated efforts. It only makes sense to spend resources on labeling images if we are able to derive value out of it.
Here we can see that the accuracy of classification increases with increase in the number of images used for training. This shows that labeling more images indeed provides business value as it improves our research efforts significantly. The prediction accuracy increases from 70% with 100 images to 88% with 351 images.
Evaluation
To ensure our models gave unbiased predictions, we used cross-validation technique which gives us a pessimistic bias which is good from business perspective. We also used different evaluation metrics like accuracy, precision, recall, F1 score, etc. to minimize business losses from misclassification.
Thus, finally we were able to achieve about 90% accuracy with a challenging dataset. The models were statistically valid and unbiased and thus were totally robust and scalable to new data.